
UPDATE
August 8 2008
Testing continues of our product. We are on the third
round of beta testing. The time is rapidly approaching where we will want a
select group of people for beta testing. If you would like to tae part in
this please email me at dsmith@radio.fm. We
would prefer that those that are testing would have access to multiple vehicles
and that they are willing to take the time to give us feedback about the whole
experience. We even may want to watch you run the tests. You can be
a seasoned professional or a shade tree mechanic. We want impute from all ends
of the spectrum.
Lastly we are going to move our website in the next couple of months. This page will remain but will eventually just point you to the new site. We are excited about this as it will allow for us to better serve you and allow us to support our product!
================================================
This started out as an idea that was the result of me not wanting to pay
my Mazda dealer for a compression test that would give me information that was not really
all that useful. I also did not want to have my car towed to the dealer to have them
perform the test and then have them try to suck me into getting it fixed or have them tell
me that it needed to have a new motor installed. Because of this I was determined to
find a way to acquire the data myself. I also was not going to purchase a Mazda factory
unit at $1,800, not even a used one for $600 - $1000.
I wanted the data in a graphical and numerical form that I could look at and make some
sense out of. This led us to invent our own compression tester that would allow us
to do just that. The following are some of the results that we have
obtained. We also wanted it to be portable. We wanted a device that you take to
the car and acquire the data then bring it back to your pc and look at it. We did not
want to have to bring the pc to the car or the car to the pc.
For those of you that are thinking that
"Hey I can make one of those and make some $$$ with it"
THE PATENTS ARE PENDING.
Putting this together has taken almost all of my spare time and that of my partners. For
the last year we have had to gather information, design, fabricate,and assemble the
components in order to make this thing work. Run tests and then re-test and verify
if the data was correct. The equipment that we use is of the highest quality.
There are export restrictions by the US government on some of the components. As you
can see this is not kid stuff. The tests we are running are very accurate. It
will allow the Shadtree mechanic as well as those at the highest levels of there
professions to have data that is very accurate, yet simple to read and interpret.
If you are interested in licensing this technology please contact us at dsmith@radio.fm and my partners and I will gladly discuss this with you.
We are also looking to get more results.
We are currently running tests on select motors for the purposes of expanding our
database. We would specifically be interested in a motor with a known problem.
It does not matter whether it is a piston engine or rotary. It is however
important to note that some cars are virtually impossible to access around the motor.
We are working on this problem but for now there must have good access to the spark
plugs. You must be willing to remove your plugs, reinstall your plugs and disable the high
voltage side of the motor's ignition system during the test. The motor that is to be
tested must have a functional starting system with a fully charged battery. The
motor will need to be run prior to the test in order to obtain normal operating
temperatures. This is so we can obtain results that are typically documented in your car's
shop manual.
Eventually (at some point in time) there
will be a "service charge" for this adventure.
Remember I come to you but I also have a real job so my time is limited.
Again if you would like a motor of yours tested contact us at the email address above.
We may be able to help, but a lot depends on your proximity and whether I already have
data on your motor.
Enough of the legal stuff, please read on. You will find descriptions under the
various graphs and you can click the various graphs to obtain a larger image.
UPDATE 10-03-04
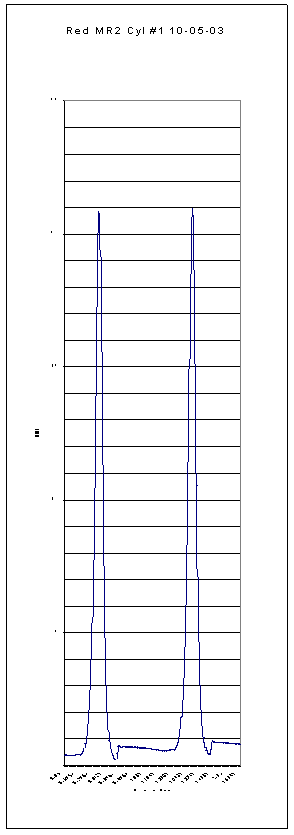
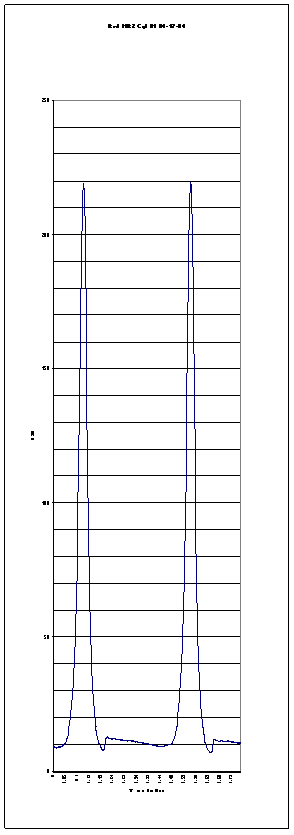
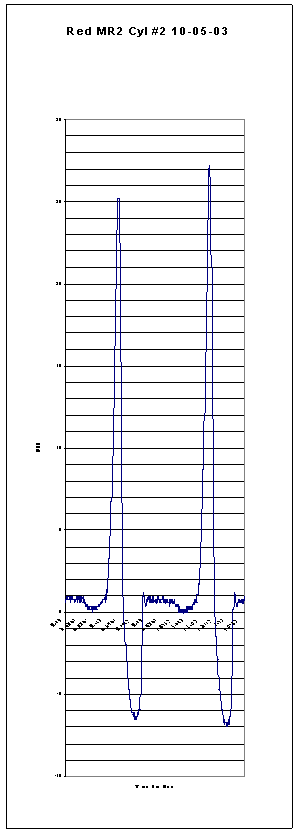
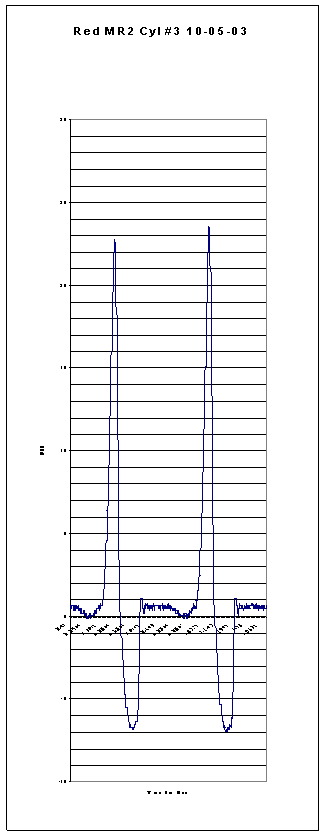
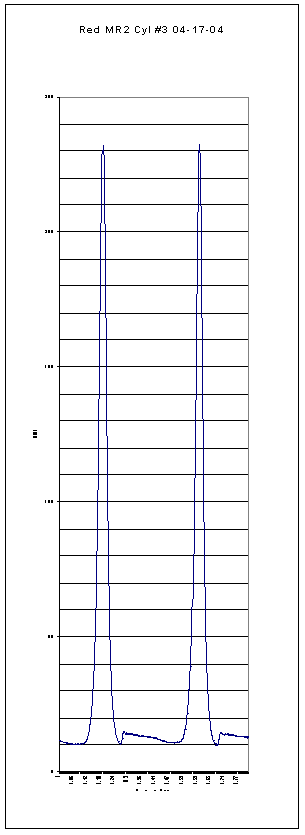
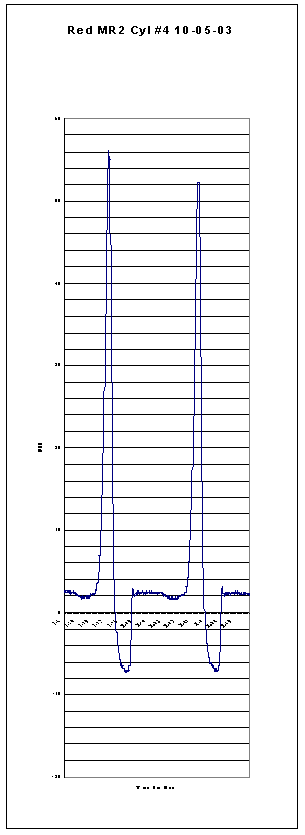
These are graphs that show before and after tests on a Toyota MR2 that I diagnosed and then rebuilt and then re tested after the rebuild
 |
 |
 |
 |
 |
 |
 |
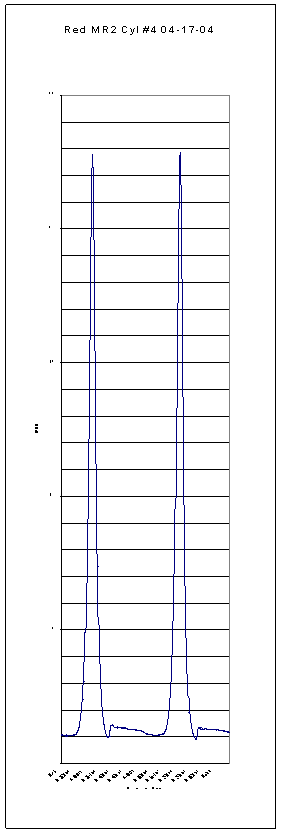 |
The above
results clearly show that the # 2,3 & 4 cylinders were in poor
shape. It turned out that the #4 cylinder had mid-land failure and broken rings
that required piston replacement.
ROTARY RESULTS
Click Graph For MUCH BIGGER Image.
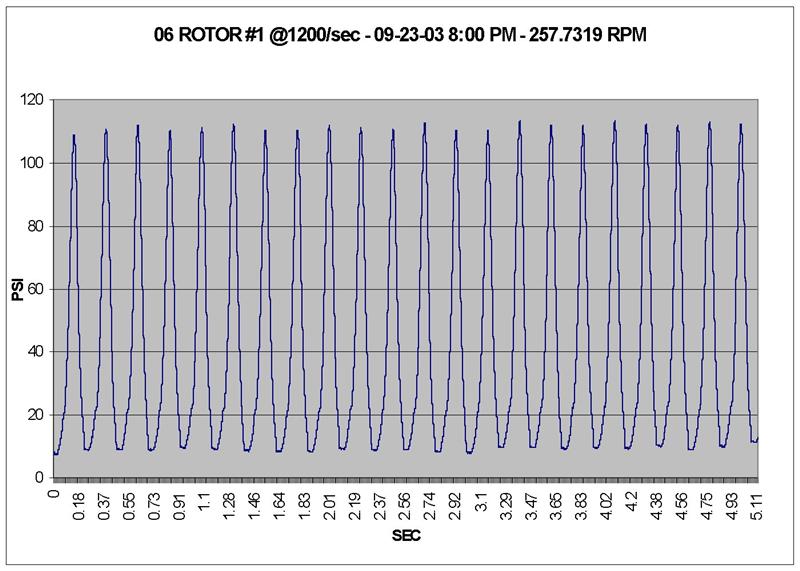
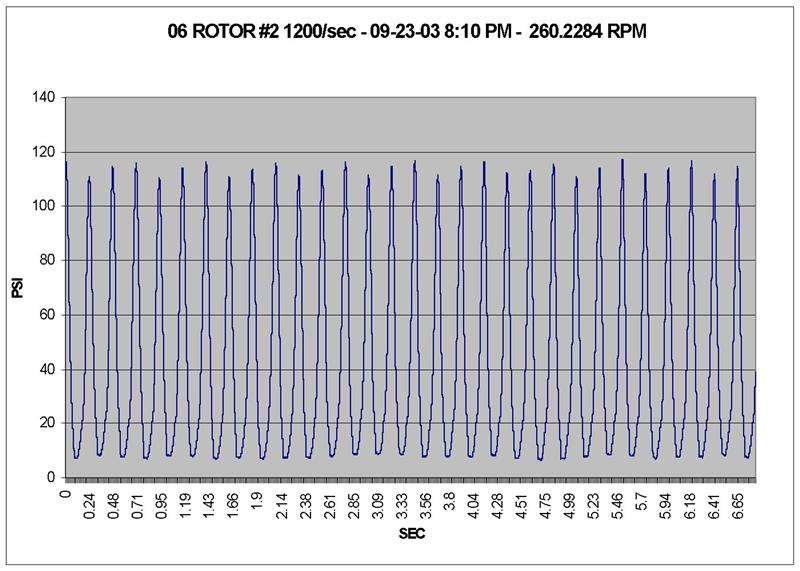
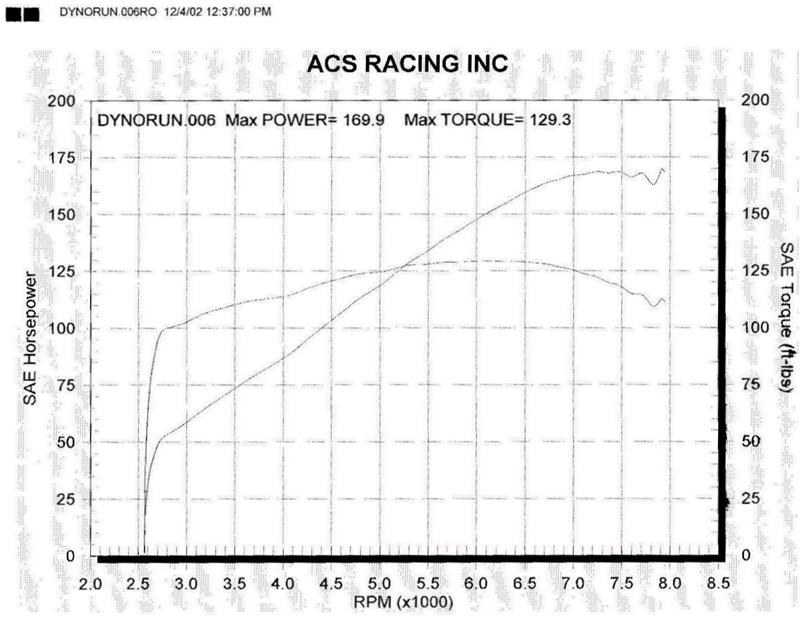
The two graphs above are from a rotary motor that was constructed using S-4 housings and S-5 rotors. Next to it is the Dyno sheet for the motor. You will notice that the readings are in the 110 PSI range on all faces of the rotors on both rotors. This seemed a bit high as the factory manual states that an S-5 motor should have a reading of around 85 PSI. It is noted in the shop manual that the S-4 motor should have a compression ratio of 9.4 to one versus the S-5 motor that has a comp ratio of 9.7 to one. But both list 85 PSI as spec for a compression test. It became obvious to us that if the compression ratio is higher in an S-5 then the PSI readings should be higher. If you scroll down you will see that we have graphed the Compression in PSI versus the Compression ratio based upon the S-4 motor spec's that are given in the Mazda Factory Manual. It verifies that if you have an S-5 motor with a compression ratio of 9.7 to one you should be getting PSI readings around 110 PSI
Click Graph For MUCH BIGGER Image.
Click Graph For MUCH BIGGER Image.
This is a graph generated from theoretical data.
We based it upon the S-4 factory manual spec with a compression rate of 9.4 /1 generating
85 PSI. Based upon this an S-5 motor will generate approximately 110 PSI based upon a comp
ration of 9.7 / 1. This was graph was generated in order to explain compression results
that were obtained from a S-4 motor that has S-5 rotors. This graph exactly replicated the
S-5 motor's 9.7/1 comp ratio PSI rating of approximately 110 PSI. It should also be noted
that this indicates that there is a printing error in the S-5 shop manual as to the
compression PSI readings that should be obtained from S-5 motors.
Click Graph For MUCH BIGGER Image.
Click Graph For MUCH BIGGER Image.
These two graphs are the test results from a
third generation RX7. Note that all the rotor faces are very close in PSI. Also note
that our equipment is able to detect a difference in two of the rotor faces indicating
that one apex seal is not sealing quite as well as the others. This is not out of
spec, it is just an example of the sensitivity of the equipment.
Click Graph For MUCH BIGGER Image.
Click Graph For MUCH BIGGER Image.
This is the test of an S-4 motor that had carbon sticking the
seals. As you can see it was in real trouble.
(Bet you can't go to Mazda and get this information.)
Click Graph For MUCH BIGGER Image.
Click Graph For MUCH BIGGER Image.
This is the same S-4 rotor after it was soaked with ATF and the carbon was dissolved. As you can see it is approaching compression numbers of a "normal" S-4 motor.
Click Graph For MUCH BIGGER Image.
This is the motor's #2 rotor after it went through the same ATF treatment. It is now within acceptable specifications for the S-4 motor.
Click Graph For MUCH BIGGER Image.
Click Graph For MUCH BIGGER Image.
This Pair of Graphs represent the bottom Portion of the compression curve for a
3rd Gen (top) and a 2nd Gen (bottom). Note the difference in the bottom of the
curve. There is a significant drop and immediate increase in the compression on the
2nd gen versus the 3rd gen that is really smooth with a small blip at the 19 PSI
Mark. The 2nd gen also has the "blip" but at around 15 PSI.
I have a lot more information on piston engines that I have not posted. I will be putting it up as time allows. It is rapidly becoming evident that not only is this a way of seeing the compression cycle of a motor but also it will generate a profile of a motor. This means I can tell if your motor has been modified (IE if you are cheating in a particular class of race cars that does not allow for modifications to the motor)
Click Graph For MUCH BIGGER Image.
Click Graph For MUCH BIGGER Image.
This is the test result from my 94 Explorer
This is a graph that represents the data acquired from the Number 1 cylinder on my
explorer. As you can see I was getting readings around 170 PSI The
entire graph represents 5 seconds of data.
Click Graph For MUCH BIGGER Image.
Click Graph For MUCH BIGGER Image.
This is the test result from my 91 Explorer
Click Graph For MUCH BIGGER Image.
Click Graph For MUCH BIGGER Image.
This is a graph of the exhaust and intake portions of the Test on my 1994 Explorer. Due to the 200 sample / sec range that I took, this is a bit choppy but with samples rates above 1,000 per second available this can be made much smoother.